Messages in the Network category sum up the statistics about the client's connection with the DME server. This means that a client's connection to the DME server for synchronization and system information exchange, and the interaction with the collaboration system are added up in the Network category. This way you can see the total connection time (here), the time spent negotiating with the collaboration system (in the Collaboration category), and the time spent synchronizing (in the Synchronizing category). The data in this category forms the basis of the statistics shown in the Analyzer tab.
The network information is shown as a table, which might look like this:
Function |
This is the type of communication which was performed with the collaboration system. For more information about each type of network connection, see below. |
Remote address |
This row states the remote IP address of the device that made the network connection, and whether the connection was secure (https). If you let the mouse pointer rest on the "secure connection" part of this row, a tooltip text will show the type of security that was in force during the connection - for instance TLS RSA with AES 256 CBC SHA. |
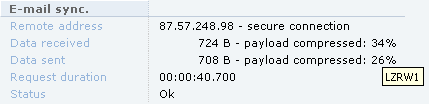
Data received |
The total amount of data received by the server, and the rate by which the "payload" part of the data was compressed. The payload is the total amount of data, less http headers etc. (which cannot be compressed). If you let the mouse pointer rest on the percentage part of this row, a tooltip text will show the technology that was employed to compress the data in this connection - for instance LZRW1. |
Data sent |
The total amount of data sent to the device by the server, and the rate by which the payload part of the data was compressed. The compression technology is shown as a tooltip. |
G/On |
For AppBox verification, this row states whether the user is permitted to use AppBox by checking with the G/On server. |
Request duration |
The total duration of the network connection, including authentication, collaboration system interaction, and synchronization. |
Status |
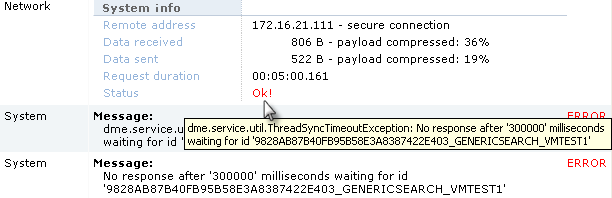
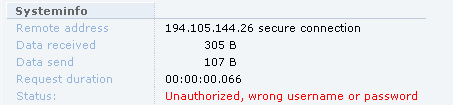
This row shows whether the current network connection was successful. Please note that the Ok simply means that the connection went well - but the connection might in fact have been an error message sent to the client. If the Ok is written in red, followed by an exclamation mark, it means that an error message was sent to the client. If you let the mouse pointer rest on the Ok, you can see the error message. See the graphic below. The message is usually preceded by a similar System category message. The other graphic below shows an entry with a non-OK status due to an authentication error. |
Stream duration |
For Adaptive push - stream closed messages, this is the total duration of the network stream session that was just closed. |
The following functions are recorded as network connection types. For each function, statistics about the connection type, total data amount, total duration of the connection, and status are shown. Note that if the function is written in square brackets, for instance [email], it is an indication that the request was unsuccessful (could not be parsed by the server).
The statistics of one synchronization process of the type mentioned. File synchronization is split into two categories: Files, which is the synchronization of data about which files should or should not be synchronized, and Files, data, which covers the files as such.
The statistics of one search process of the type mentioned. The generic Search function is another name for E-mail search. RnR search is a search for Rooms & Resources when booking a meeting on the device.
The statistics of one adaptive push (network push) session. The Stream started message means that a network push stream was started by the client. In the client, the lightning symbol ![]() is shown. Stream closed means that the network push stream was closed again by the client, for instance if the phone is switched off or the connection is otherwise lost. The (IM) variant indicates that the client has the Sametime awareness functionality turned on.
is shown. Stream closed means that the network push stream was closed again by the client, for instance if the phone is switched off or the connection is otherwise lost. The (IM) variant indicates that the client has the Sametime awareness functionality turned on.
The statistics of one provisioning function, either by way of OMA DM provisioning or SMS self-provisioning, or the size of the client download, or the packets sent in by a device when retrieving the device DM tree.
Attachments: E-mail or meeting attachments uploaded to or downloaded from the server.
Commit: The process of confirming that a transaction such as a synchronization went well. If a transaction is not committed, it will be rolled back.
Diagnostic: The statistics of a device sending in its diagnostic log for analysis.
Password change: The statistics of a user changing his or her network password from the device.
Root certificate: The statistics of a user downloading the DME root certificate to his or her device.
SmartLink: The statistics of a user using the SmartLink add-on functionality.
Statistic: The statistics of a device sending in voice, messaging, and GPRS data usage statistics for use in the Analyzer view.
Time zones: The server sending a list of known time zones to the client, so the client can match its time zone with that of the server.
Verify credentials: Data exchanged between the DME server and G/On to verify that a user is permitted to use AppBox on the clients.