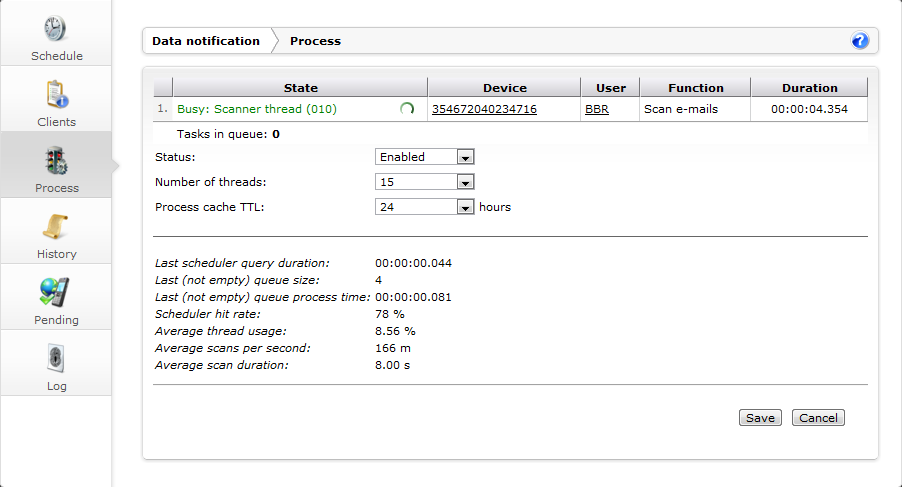
In the Process section of the Data notification panel you can specify features of the way DME scans the collaboration system for changes in users' mailboxes etc. You can turn scanning on or off, and you get a live view of the scanning processes (the scanner threads).
Each time the notification scheduler is run (see Notifications), it finds out which users' mailboxes need to be scanned, and for what. For instance, it may be time to scan the calendar for 20 users. All these scanning tasks are placed on the queue shown in this section. Each scanner thread takes care of one scanning task. The number of tasks currently on the queue is shown at the bottom of the table after the text Tasks in queue.
DME makes use of a so-called a command stack - a list of commands to be processed when the client connects to the server. For more information about the command stack, see the next section: Command stack priorities.
The table part shows the currently busy threads - up to the number specified in the field Number of threads below. If the server is currently not scanning the collaborations system, no threads are shown. If any scanning tasks are waiting to be processed (apart from the ones shown in the table), then the number of tasks in queue is displayed below the table. The number shows the difference between the total number of current scanning tasks and the the number specified in Number of threads.
Table columns:
This column shows that a thread is active. This is also indicated by an animated thread icon: ![]() . The number in parentheses is an internal number used to identify the thread.
. The number in parentheses is an internal number used to identify the thread.
This column shows the device whose owner's mailbox is is being scanned. If you let the mouse pointer rest on a device link, a box will appear with more information about the current device. Click the device link to view and edit the device in the Device setup panel.
This column shows the user name of the user whose mailbox is being scanned. If you let the mouse pointer rest on a user link, a box will appear with more information about the current user. Click the user link to view and edit the user in the User setup panel.
This column shows the item type that is scanned for (E-mail, Calendar, etc.).
This column shows the duration of the scan. This duration is used as a basis for the statistics below, among other things.
Using the fields below the table, you can enable or disable scanning, tune the server's use of threads, etc. After changing values, click Save to commit the new settings to the DME server.
Fields:
This might be called the "notification framework main switch". This field is initially set to Disabled (after installing the DME server). When the server has been set up and is working as intended, change the status to Enabled in order to start the notification framework and enable push notification to the clients.
In this field you choose the number of threads to be used for client connections. You can choose numbers in increasing intervals between 1 and 50. The higher the number, the greater the load on the server. The number of threads should be balanced with the number of users, the tightness of the notification schedules, and the capabilities of the server hardware.
TTL means "Time To Live". This setting adjusts the length of time the Pending flag is allowed to exist before it is cleared by the server. The scanner will reissue a notification if the notification has not been cleared by the client within the time set by the process cache TTL. For more information, see the Pending panel section.
This value only applies if you are not running with Exchange subscriptions (see Setting the scheme). If you are using Exchange subscriptions, a new notification will be sent to the device on every event, only limited by the Adaptive Push setting Max. notifications if no response from a device. This is to accommodate devices that have no background sync ability, such as Apple iOS devices, where the Notification Center will then build a complete list of received e-mail notifications rather than just one that may cover any number of received e-mails. The notifications are cleared when the device synchronizes with the server.
Finally, a set of statistics is shown in the bottom pane. You can use these statistics when tuning the server.
Statistics:
How long time did it take for the scheduler to read "who" and "when" to scan from the DME database. The duration applies to the result currently shown in the window.
How many tasks were added to the queue. The queue size applies to the last time a non-zero number of tasks were found.
How long time did it take to process the entire queue. The process time applies to the number of tasks in the field Last queue size above.
How many times does a query for tasks result in new tasks. For instance: If the result is 50%, it means that half the queries to the DME database find new entries in the scanning queue.
How many of the maximum number of threads (from the field Number of threads) are used on average. This average is based on a round-robin principle. Thread usage is sampled frequently, and the average is calculated over one hour's worth of samplings.
How many scans are performed per second. For instance, a value of 789m means that in one second, DME scans 789 "millitasks" - almost 0.8 task per second. This average is also based on a round-robin principle, and calculated over one hour's worth of samplings.
How long time does each scan take on average. For instance, a value of 652m means one scan per 652 milliseconds - about 0.65 second. This average is also based on a round-robin principle, and calculated over one hour's worth of samplings.
In the trends graph Notification scanner thread usage, you can see some of these statistics graphically over time. See Monitor.